Published on
How I optimize SQL queries (ft. Chatwoot)
Chatwoot is a popular open-source platform for talking to your customers, and it is built using Ruby on Rails. As the product and our usage grew, performance bottlenecks started to appear. I had the opportunity to work with a lot of them, which served as an excellent opportunity for me to learn a lot. Over time I slowly built some intuitive understanding of problems like these, so I decided to put them in words, or at least try to do so.
97.42%* of all scaling bottlenecks stem from databases … In the face of a database bottleneck, every other optimization in an application pretty much immediately becomes immaterial.
- Totally made up stats ft. Zerodha
Before we begin, this blog might not serve you well if you’re starting your journey as a developer, but if you’re working on web apps serving more than a thousand active users daily, you might find what I have to say helpful. I’ll pick examples from my PRs, with PostgreSQL as the database for all of them, but most of these principles should also apply to other SQL databases.
Talk to your DB more
Databases are complicated pieces of software and are often treated as a black box. But they are not; they are a piece of software that can be debugged and optimized. The first step to optimizing your queries is to understand what’s going on inside the database, and this is not just the database app but also the data it holds. Any team must monitor their DB health continuously. I like to classify this monitoring into “running metrics” and “schema health metrics”.
Running Metrics
Running metrics are those you track in real-time, like long-running queries, blocked queries, IOPS, memory and CPU usage, etc. If you’re using a managed SQL service like RDS, the platform metrics should serve you well; tools like PGHero are great open-source apps you can have in your arsenal. Chatwoot uses a combination of platform metrics from RDS and New Relic metrics.
Schema Health Metrics
Beyond standard metrics, I also suggest monitoring the health of your schema. Here is a screenshot of the metrics I track using Metabase, which helps me immensely when debugging slow queries.
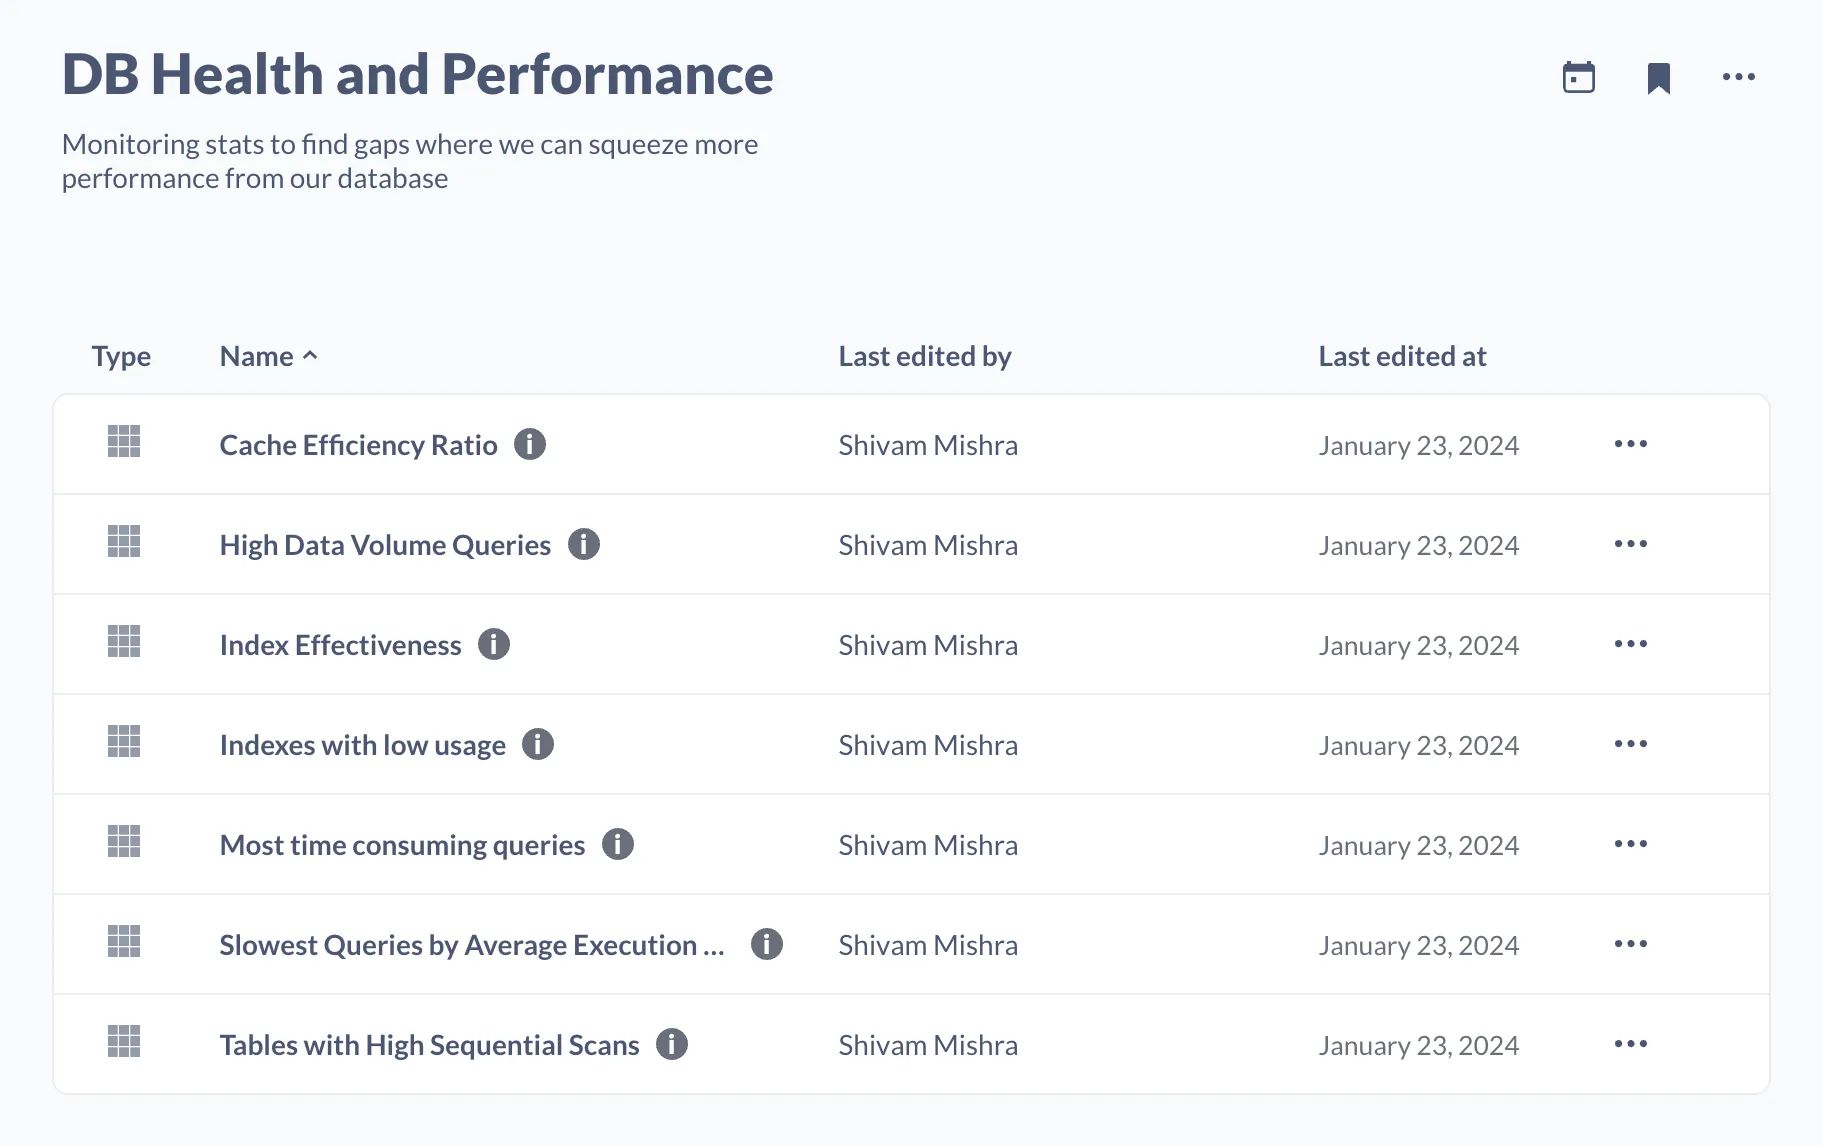
These metrics include cache efficiency ratio, index effectiveness, and index with low usage. Schema health metrics become extremely useful when traditional scaling methods are no longer cost-effective. This blog I wrote a while back has all the metrics from the screenshot above and how to interpret them.
Better, not more indexes
Indexing, when used correctly is almost always a silver bullet. I cannot emphasize the “used correctly” part enough. More indexes use more memory and storage and can drastically slow inserts, updates, and deletions down. EXPLAIN is your friend here; the best way to make yourself good at solving DB bottlenecks is to become an expert at reading query plans.
The Contact Chronicles
The contacts table in Chatwoot can get huge. For a website with the chat widget embedded, every visitor who interacts with the widget is added to the DB as a Contact; however, not all customers end up completing a conversation; they only show up on the UI when the visitor provides their email/phone-number or is verified by the website owner via an identifier. While we periodically clean up the tables, we do have to wait for a cooling period until we can delete the data. This means the table grows exceptionally huge, and the queries can be slow.
We had a seemingly simple query that took a lot of time, and the query did not use the already present index. Here’s the query:
SELECT
  COUNT(*)
FROM
  "contacts"
WHERE
  "contacts"."account_id" = 1
  AND (
    COALESCE(
      NULLIF(contacts.email, ''),
      NULLIF(contacts.phone_number, ''),
      NULLIF(contacts.identifier, '')
    ) IS NOT NULL
A partial index was perfect for this query. Here’s the index we added
CREATE INDEX index_contacts_on_identifiable_fields
ON contacts (account_id, email, phone_number, identifier)
WHERE (email <> '' OR phone_number <> '' OR identifier <> '');
All that was left was to update the query to ensure it used the newly built index. With this change, the parallel sequential scans were now an Index-only scan. The query was faster, taking the execution time from 16 seconds to 1.2 seconds for our test case. Here’s the pull request: chatwoot/chatwoot#7175, which made the change.
SELECT COUNT(*)
FROM "contacts"
WHERE "contacts"."account_id" = 1
  AND (
    (contacts.email <> '')
    OR (contacts.phone_number <> '')
    OR (contacts.identifier <> '')
  );
Later, I added a follow-up PR that added account_id to the index, making the query even faster. Here’s the PR chatwoot/chatwoot#7629
Context matters
Context is everything, and this is especially true regarding SQL queries. What framework/ORM you’re using, what the data looks like, and what the business logic is all matter when it comes to optimizing queries.
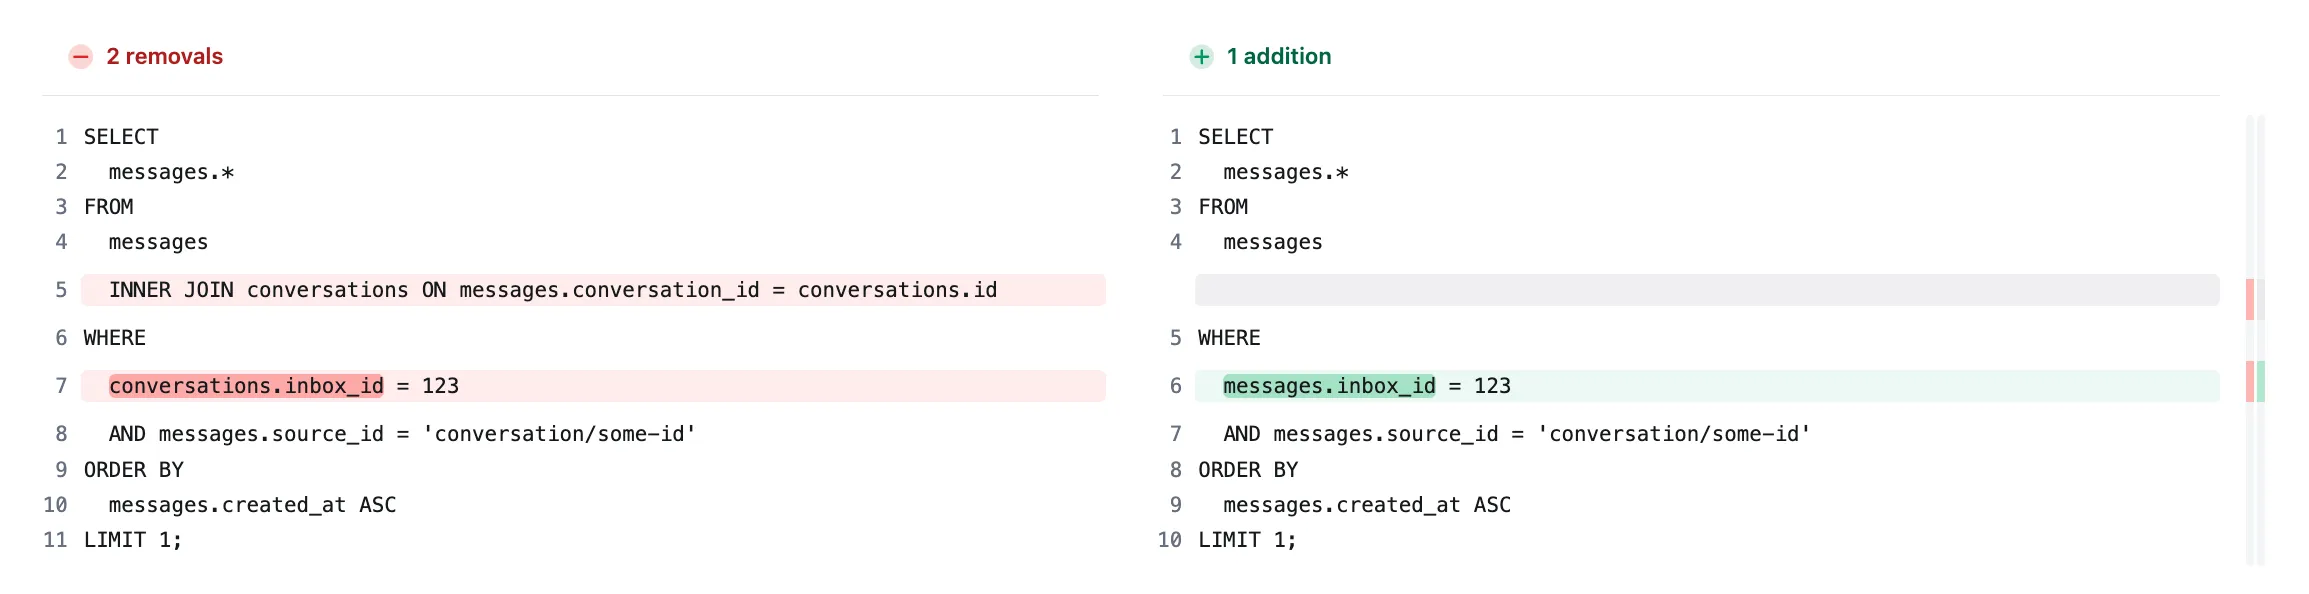
In chatwoot/chatwoot#8763, we removed an unnecessary JOIN that slowed the search, just removing that took the execution time from 365ms to 1.7ms. Here’s the change we made
SELECT
  messages.*
FROM
  messages
  INNER JOIN conversations ON messages.conversation_id = conversations.id
WHERE
  conversations.inbox_id = 123
  AND messages.source_id = 'conversation/some-id'
ORDER BY
  messages.created_at ASC
LIMIT 1;
SELECT
  messages.*
FROM
  messages
WHERE
  messages.inbox_id = 123
  AND messages.source_id = 'conversation/some-id'
ORDER BY
  messages.created_at ASC
LIMIT 1;
The query was like that in the first place because there was a model association between Inbox, Message and Conversation. (BTW, This is a rails app; ignore it if you’re not familiar with it)
# app/models/inbox.rb
has_many :messages, through: :conversations
This meant all the queries that were being made on messages were being made through conversations as well, which was not needed in this case since the rest of the models ensure that the inbox.id and the associated conversation.id are always consistent.
If you look at this, the solution to the problem lies in the code itself, Rails in this case, and not the database. This is why it’s essential to understand the context of the query and not just the query itself. This context does not always come from the code, the business logic, and the data itself. The following principle is an excellent example of how knowing the data context helps us speed up queries.
No amount of indexes can save a bad query
Lets look at this PR chatwoot/chatwoot#6802, here the query saw a speed boost upto 10x by removing a join. If you look at the diff, the JOIN was replaced by a sub-query. Usually, sub-queries are not considered suitable for performance, but it was the right thing to do in this case.
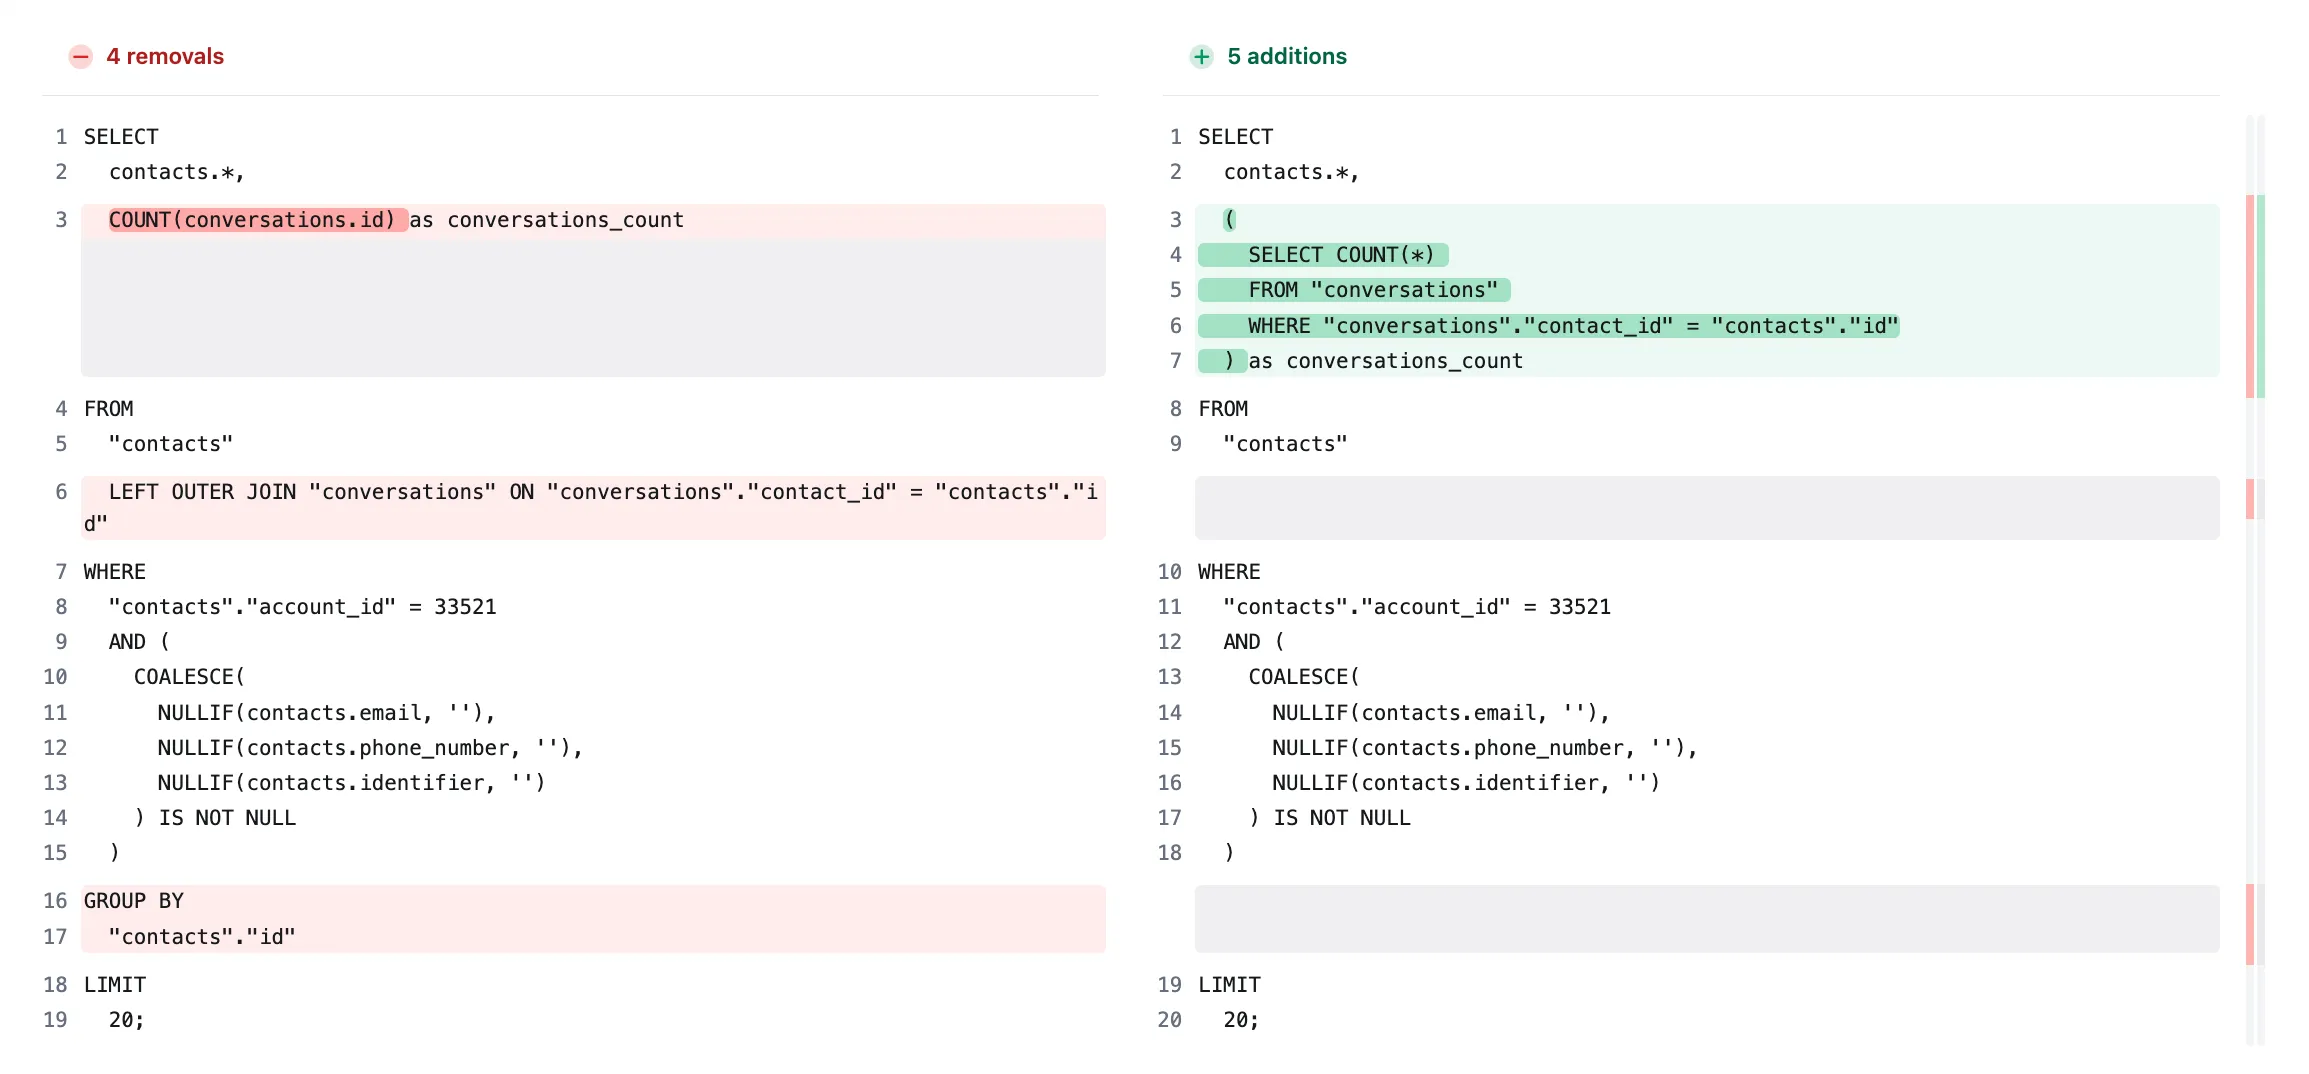
Notice the join that expands the search scope and then the GROUP_BY, which increases the specificity of the data requested. Usually, you avoid doing a count inside your select, but this works here. Context matters
The new query performs way better than the old one, and here’s why
-
Simpler Execution Plan: The subquery version simplifies the query execution by directly correlating the count of conversations to each contact, reducing the complexity of joining tables. This eliminates the need for a more expensive Group Aggregate operation, as seen in the first query.
-
Efficient Index Use: It makes better use of indexes, especially the one on
contact_idfor the subquery, to quickly find matching rows, leading to faster row retrieval without scanning unnecessary rows. -
Reduced Rows Processed: By counting conversations per contact directly within the subquery, PostgreSQL efficiently limits the amount of data processed and avoids the overhead of grouping and joining large datasets.
-
Better resource utilization: Avoiding a full outer join reduces memory and CPU usage, as the database engine can focus on retrieving and counting relevant rows for each contact without maintaining extensive in-memory structures for the join and group by operations.
The fastest query is the one that you don’t run
We faced an issue where conversation counts for contacts would slow down the query to the point it would timeout. The best solution was to remove the query altogether since the data was not very useful for that particular view. Here’s the chatwoot/chatwoot#7915 that removed the query.
Or this chatwoot/chatwoot#8733, where we’re computing information shared across reports, but then not all of the data was required when fetching all the reports at once. This problem was a classic case of over-fetching, and the solution was to remove the metrics not used.
Benchmark across different data sizes
Data is not homogeneously distributed; an index that speeds up a large search area may not work on a small amount of data. It’s important to benchmark your queries across different data sizes, not just the production data but also the test data.
In chatwoot/chatwoot#6802, we can see how the same query can behave differently on different data sizes. Here’s a screenshot of the benchmarking I did for the PR.
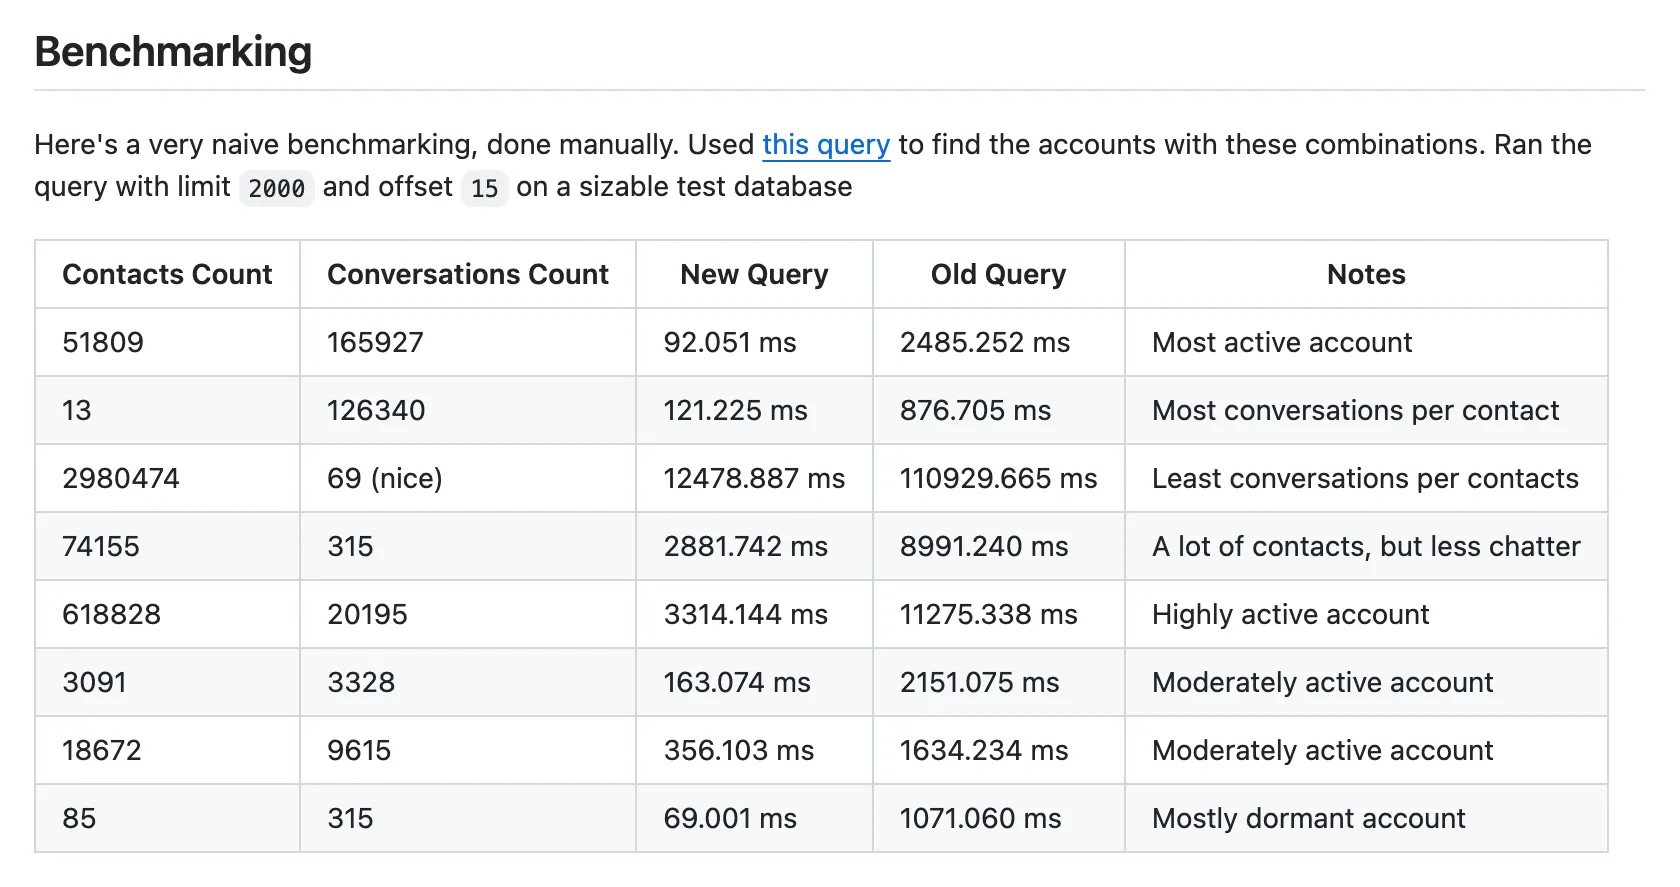
In this case, the perf gains for the case where the account has a tiny amount of conversations but a lot of contacts, the difference in performance was not significant, but this is acceptable since the perf gains for the other case were significant.
Another PR chatwoot/chatwoot#7629 shows that performance improvement for smaller accounts is relatively smaller, but there are still good gains across the board.
Know your tools
You can only be as precise as your tools and dive as deep as your tools allow. You’ll need a test bed to run queries on, and I use Postico locally, which serves excellent for almost all cases. Fundamentally, all you need to know about the query to optimize most of them is the plan and the schema, but there will be times when one will find a need to run these queries against real-world data. I’ve discovered Metabase to be the perfect tool to do this (as long as you configure the privileges appropriately). Using Metabase lets all your engineers have a safe way to access production data without worrying about accidentally performing any disruptive action.
Another tool that is indispensable to me is the query plan visualizer by Dalibo. While you could just read and understand the query plan, having a visual medium makes it much more intuitive to understand what’s going on. Take look at this optimized and unoptimized query from chatwoot/chatwoot#7629, which I made a while back. Feel free to take a peek at the other visualized query plans linked in the PR
If you’re using Rails, rack-mini-profiler is a great tool to profile your queries, and it’s straightforward to set up. For chatwoot/chatwoot#7228, the profiler helped me identify an N+1 query slowing down the conversation list API. I had to revert the query :P it didn’t work as well on production as I expected. You can also use the bullet gem to identify N+1 queries, but I’ve found it to be a bit noisy.
You can also build your test utilities; we used k6 to benchmark the N+1 fix on production. Here’s the script I used.
As a Pythonista, it would be unfair not to mention django-silk from Jazzband
Don’t buy complexity for performance
Generally speaking, an application that serves 1000 requests per second of static data differs from one that serves data from a database. While measures like latency matters a lot, it’s not always. Some performance hiccups can be tolerated, such as data visualizations of over 100K messages, so your customers are okay with it if it takes 3 seconds to load up. Without knowing the system’s constraints, your optimization is for vanity and not performance.
Sometimes, slow is fine, and in rare cases, it is also preferable. We faced some issues with concurrency, where some of our incoming webhooks or API requests would get in a race condition. We solved this with a very Redis-based semaphore in chatwoot/chatwoot#7701. While this change is far from a technical marvel and won’t work for a scale much larger than ours, it works for us. All this achieved was to delay the job just slightly enough for us to avoid any concurrency issues, and it did it reliably without adding something like Kafka to the mix.
Dumb caching is better than smart queries
Especially with context, caching is almost a silver bullet. When a request looks up data in a cache and dumps it directly in the response, that’s a dumb cache. The caching logic does not understand the semantics or structure of the stored data and simply acts as a transparent layer between a function and the response. Here’s a simple example from Chatwoot
# lib/integrations/openai_base_service.rb
def perform
  return nil unless valid_event_name?
  return value_from_cache if value_from_cache.present?

  response = send("#{event_name}_message")
  save_to_cache(response) if response.present?

  response
end
We take this a step further with IndexedDB on the front end to store data, which only changes sometimes, with a simple mechanism to store cache keys in Redis used for invalidation. It may be a topic for another blog.
These are the principles I follow when optimizing queries. I hope you found them helpful, and if you have any questions, don’t hesitate to contact me on Twitter. If you maintain an open-source project, I’d love to help you out with your SQL queries. Email me at hey[at]shivam.dev, and I’ll be happy to help you.
If you’re interested in reading more about getting the most out of your DB, here are a few links I found helpful:
- https://use-the-index-luke.com/
- Performance Tips - postgresql.org
- https://sqlfordevs.com/ebooks/indexing
- Perf is not enough
📫 Get updates!
I'll send an email only when I publish something on my blog, which is usually once month at best, and you can unsubscribe instantly at any time.
No spam, unsubscribe at any time. Scout's honor.